
1、Prometheus 介绍及部署
Prometheus 介绍Prometheus(普罗米修斯)基于Go语言开发,是一套开源且免费的监控系统。
Prometheus于2016年加入CNCF(云原生基金会)成为继Kubernetes之后的第二个托管项目,目前主要应用在云原生与容器领域的监控解决方案。
项目托管:https://github.com/prometheus
1.1、Prometheus 特点
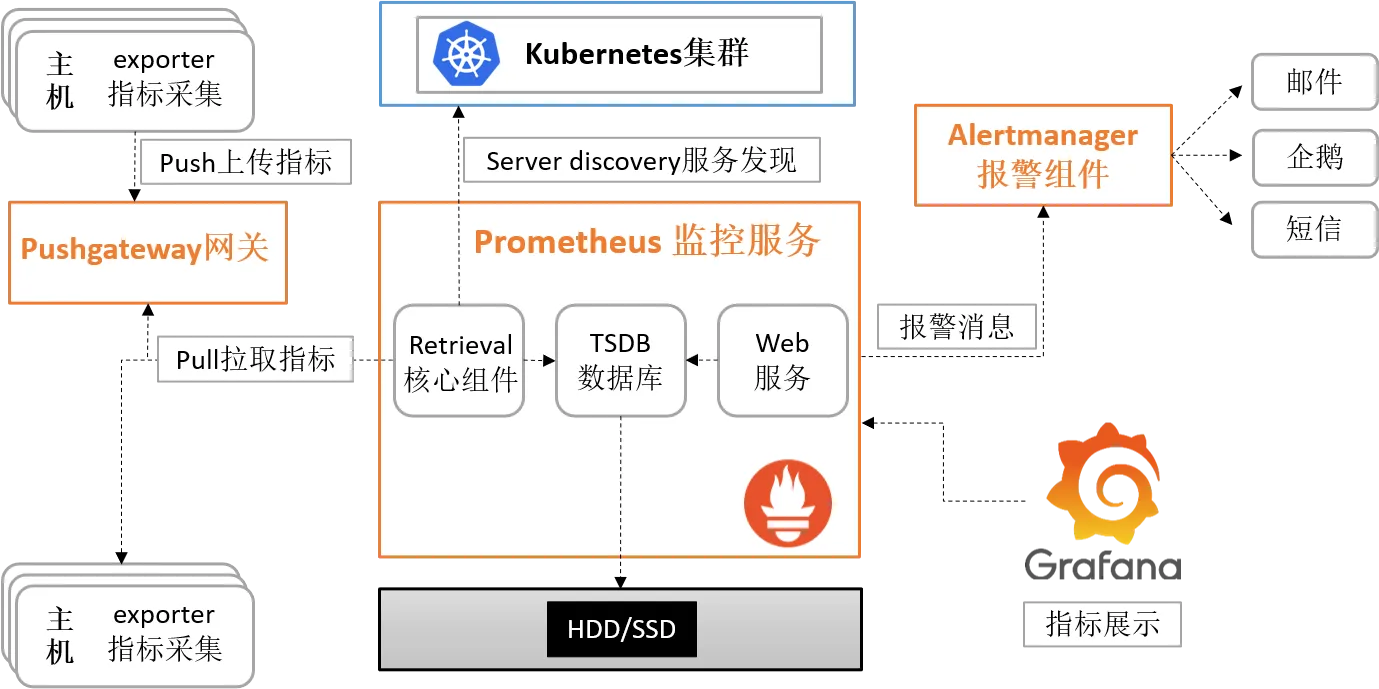
作为新一代的监控系统框架,Prometheus具备以下特点:
基于HTTP的 pull(拉取)方式采集指标数据,利用TSDB(时序数据库)存储指标数据
PromQL 作为TSDB数据库的灵活查询语言,可完成复杂的查询操作
PushGateway作为Prometheus的代理节点,可用于分布式监控可通过配置文件与动态发现规则发现监控目标
提供web界面图形化数据展示,支持第三方数据展示(如:Grafana)
1.2、Prometheus 软件下载
Prometheus 相关的软件包是编译后的二进制包,没有任何依赖,解压并且添加基本的配置即可正常启动Prometheus。
prometheus :监控端程序,提供监控服务。
node_exporter :节点指标采集器,用于采集节点监控指标数据。
Linux命令行下载方式
wget https://github.com/prometheus/prometheus/releases/download/v3.5.0/prometheus-3.5.0.linux-amd64.tar.gz
wget https://github.com/prometheus/node_exporter/releases/download/v1.9.1/node_exporter-1.9.1.linux-amd64.tar.gz
1.3、实验环境主机规划
1.4、安装 node_exporter
解压软件包,并将解压后的目录移动要/usr/local/目录
tar -xf node_exporter-1.9.1.linux-amd64.tar.gzmv node_exporter-1.9.1.linux-amd64 /usr/local/node_exporter创建 node_exporter 系统服务文件
cat > /etc/systemd/system/node_exporter.service <<EOF
[Unit]
Description=node_exporter
After=network.target

[Service]
Restart=on-failure
ExecStart=/usr/local/node_exporter/node_exporter

[Install]
WantedBy=multi-user.target
EOF
启动 node_exporter 服务
systemctl enable node_exporter --now 查看 node_exporter 服务端口
netstat -ntlp | grep node_exporter
...
tcp6   0    0 :::9100  :::*    LISTEN  1490/node_exporter
1.5、安装 Prometheus
解压 prometheus 压缩包,并移动到/usr/local/目录
tar -xf prometheus-3.5.0.linux-amd64.tar.gzmv prometheus-3.5.0.linux-amd64 /usr/local/prometheus创建 prometheus 系统服务文件
cat > /etc/systemd/system/prometheus.service <<EOF
[Unit]
Description=Prometheus Server
Documentation=https://prometheus.io/docs/introduction/overview/
After=network-online.target

[Service]
Restart=on-failure
ExecStart=/usr/local/prometheus/prometheus --config.file=/usr/local/prometheus/prometheus.yml --storage.tsdb.path=/var/lib/prometheus --web.external-url=http://0.0.0.0:9090

[Install]
WantedBy=multi-user.target
EOF
修改/usr/local/prometheus/prometheus.yml文件,添加被控主机
...
scrape_configs:
  - job_name: "prometheus"
    static_configs:
      - targets: ["localhost:9090","192.168.0.10:9100"]
        labels:
          app: "prometheus"
启动 prometheus 服务
systemctl enable prometheus --now查看 prometheus 服务端口
netstat -ntlp | grep prom
...
tcp6   0   0 :::9090    :::*    LISTEN    1529/prometheus
2、部署被控主机
2.1、实验环境主机规划
2.2、安装 node_exporter
解压软件包,并将解压后的目录移动要/usr/local/目录
tar -xf node_exporter-1.9.1.linux-amd64.tar.gz创建 node_exporter 系统服务文件
cat > /etc/systemd/system/node_exporter.service <<EOF
[Unit]
Description=node_exporter
After=network.target

[Service]
Restart=on-failure
ExecStart=/usr/local/node_exporter/node_exporter

[Install]
WantedBy=multi-user.target
EOF
启动 node_exporter 服务
systemctl enable node_exporter --now 查看 node_exporter 服务端口
netstat -ntlp | grep node_exporter
...
tcp6   0    0 :::9100  :::*    LISTEN  1490/node_exporter
2.3、准备 docker 环境
添加华为云 docker-ce 仓库
cat > /etc/yum.repos.d/docker-ce.repo <<EOF
[docker-ce-stable]
name=Docker CE Stable - \$basearch
baseurl=https://mirrors.huaweicloud.com/docker-ce/linux/centos/9/\$basearch/stable
enabled=1
gpgcheck=1
gpgkey=https://mirrors.huaweicloud.com/docker-ce/linux/centos/gpg
EOF
安装 docker 软件包
dnf install docker-ce-20.10.24-3.el9.x86_64 -y启动 docker 并设置随机自启
systemctl enable docker --now配置 docker 镜像加速器
cat > /etc/docker/daemon.json <<EOF
{
        "registry-mirrors": ["https://docker.1ms.run"]
}
EOF
重启 docker 使配置生效
systemctl daemon-reload && systemctl restart docker2.4、部署 cAdvisor 环境
cAdvisor 是一款开源的容器指标数据采集工具,它被内嵌到 k8s 中作为 k8s的监控组件。
在被控主机安装(哪台主机需要监控容器就在哪台主机安装)
VERSION=v0.49.1
sudo docker run \
  --volume=/:/rootfs:ro \
  --volume=/var/run:/var/run:ro \
  --volume=/sys:/sys:ro \
  --volume=/var/lib/docker/:/var/lib/docker:ro \
  --volume=/dev/disk/:/dev/disk:ro \
  --publish=8080:8080 \
  --detach=true \
  --name=cadvisor \
  --privileged \
  --device=/dev/kmsg \
gcr.io/cadvisor/cadvisor:$VERSION浏览器访问:http://IP 地址:8080

2.5、Prometheus 添加被控主机
在 prometheus 主机修改prometheus.yml文件,监控 cAdvisor
cd /usr/local/prometheus...
scrape_configs:
- job_name: "prometheus"
static_configs:
- targets: ["localhost:9090","192.168.0.10:9100","192.168.0.11:9100","192.168.0.11:8080"]
labels:
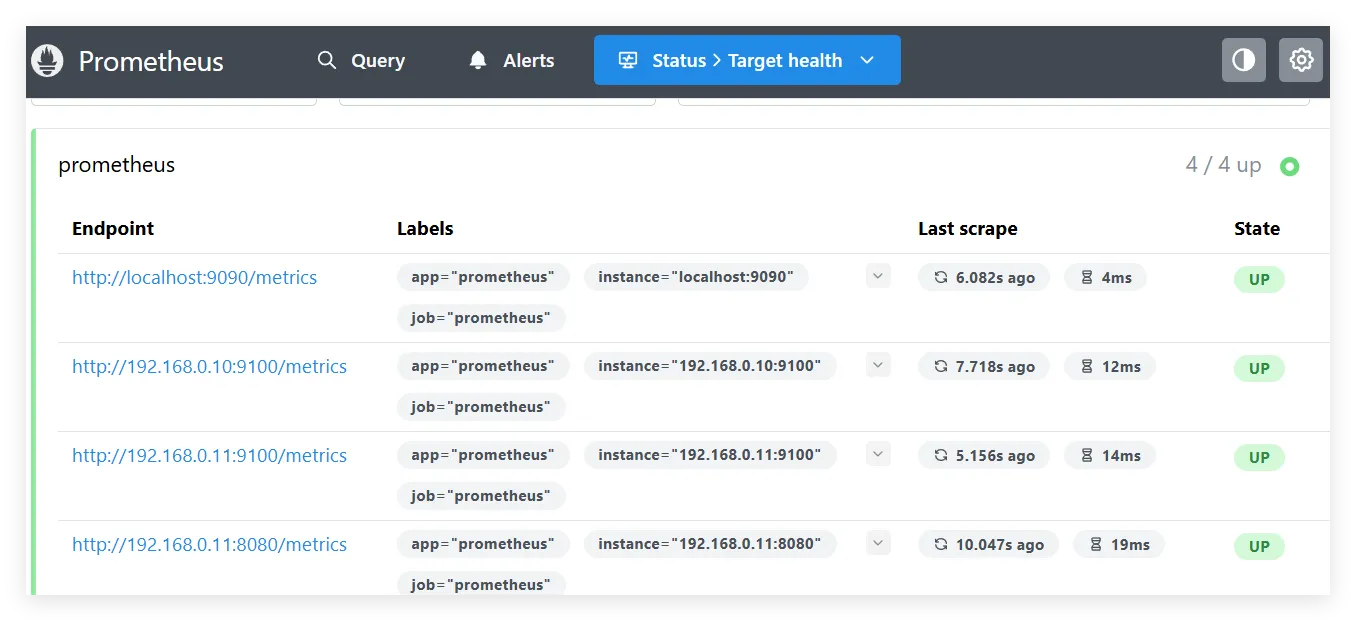
app: "prometheus"重启 prometheus 服务
systemctl restart prometheus浏览器访问 prometheus 主机:http://IP:9090
3、Grafana 展示指标
3.1、Grafana 介绍及部署
Grafana是一款开源数据可视化平台,做数据监控和数据统计。
3.2、安装 Grafana 软件包
在 prometheus 主机安装,软件包可从清华大学源下载:
这里安装10.1.1.1版本
wget --no-check-certificate https://mirrors.tuna.tsinghua.edu.cn/grafana/yum/rpm/grafana-7.2.1-1.x86_64.rpm安装 grafana 软件包
dnf -y install grafana-5.4.2-1.x86_64.rpm 启动 grafana 并设置随机自启
systemctl enable grafana-server --now查看 grafana 端口
netstat -ntlp | grep grafana
tcp6 0 0 :::3000 :::* LISTEN 2310/grafana-server浏览器访问:http://IP:3000
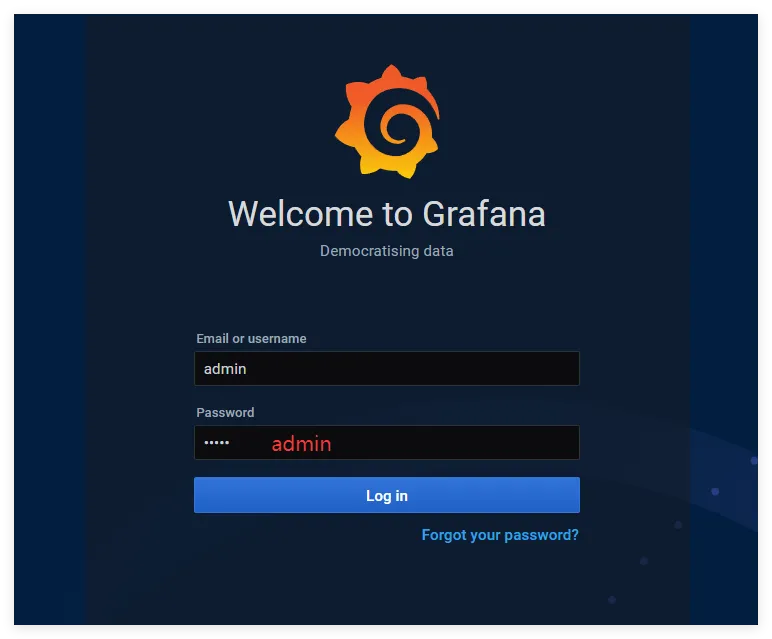
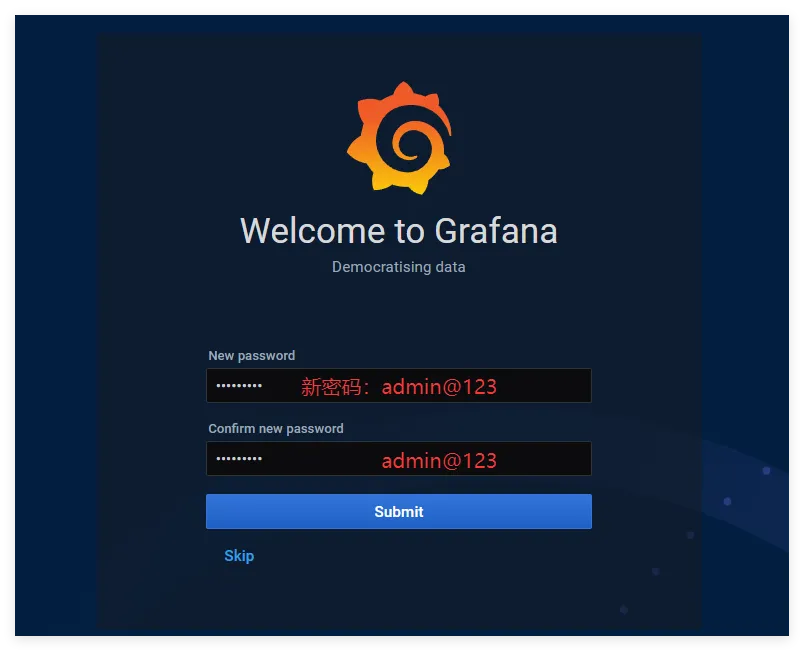
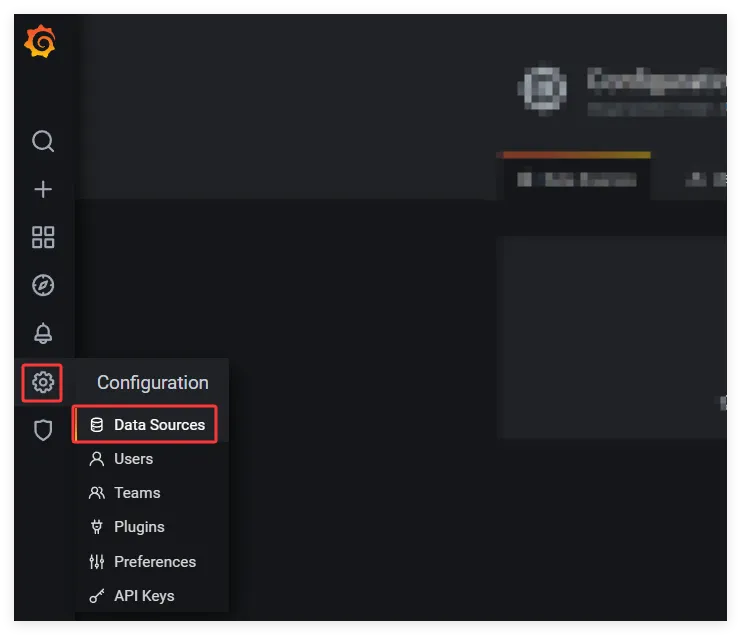
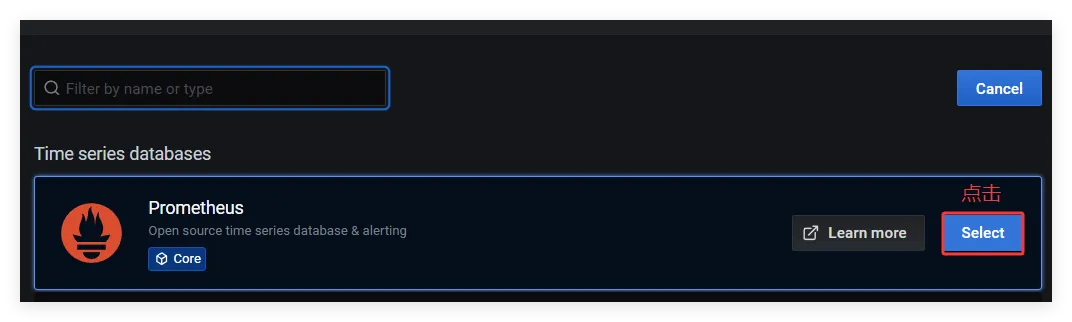
3.3、Grafana 添加 Prometheus
将 prometheus 地址添加到 grafana 中
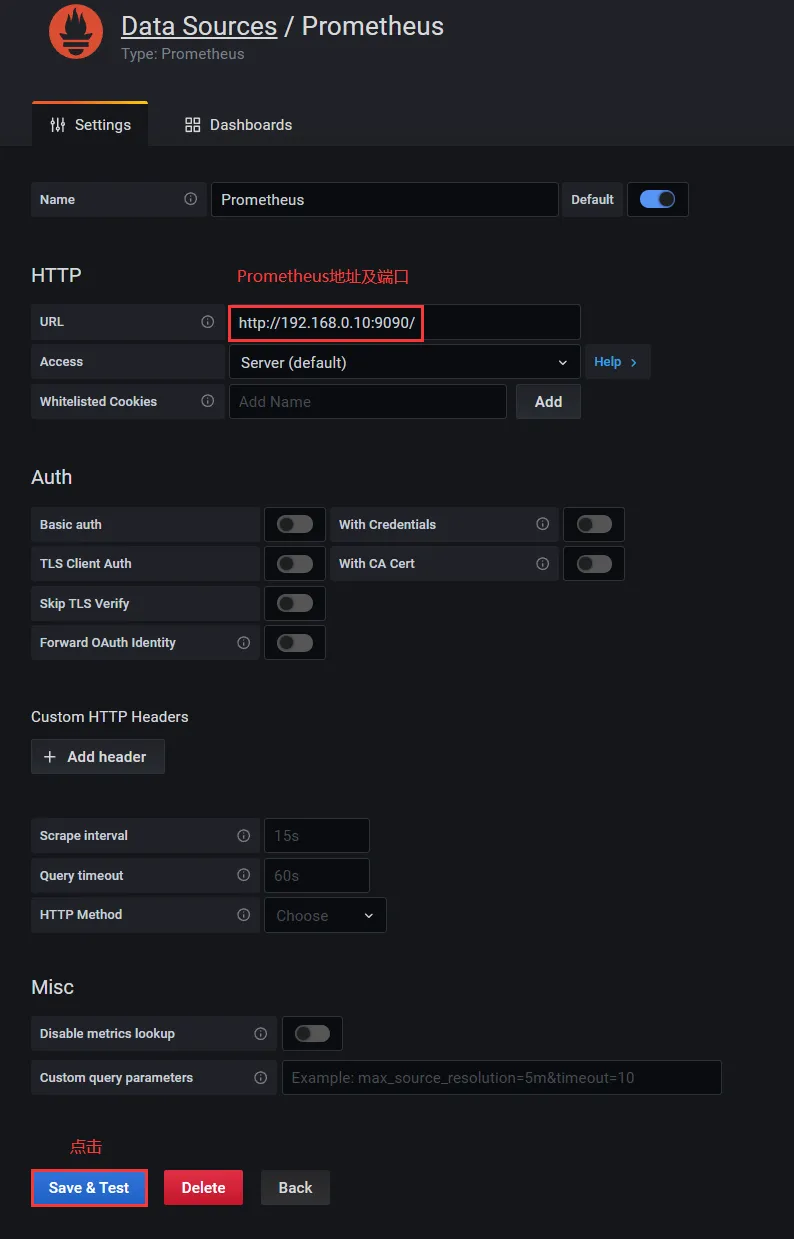
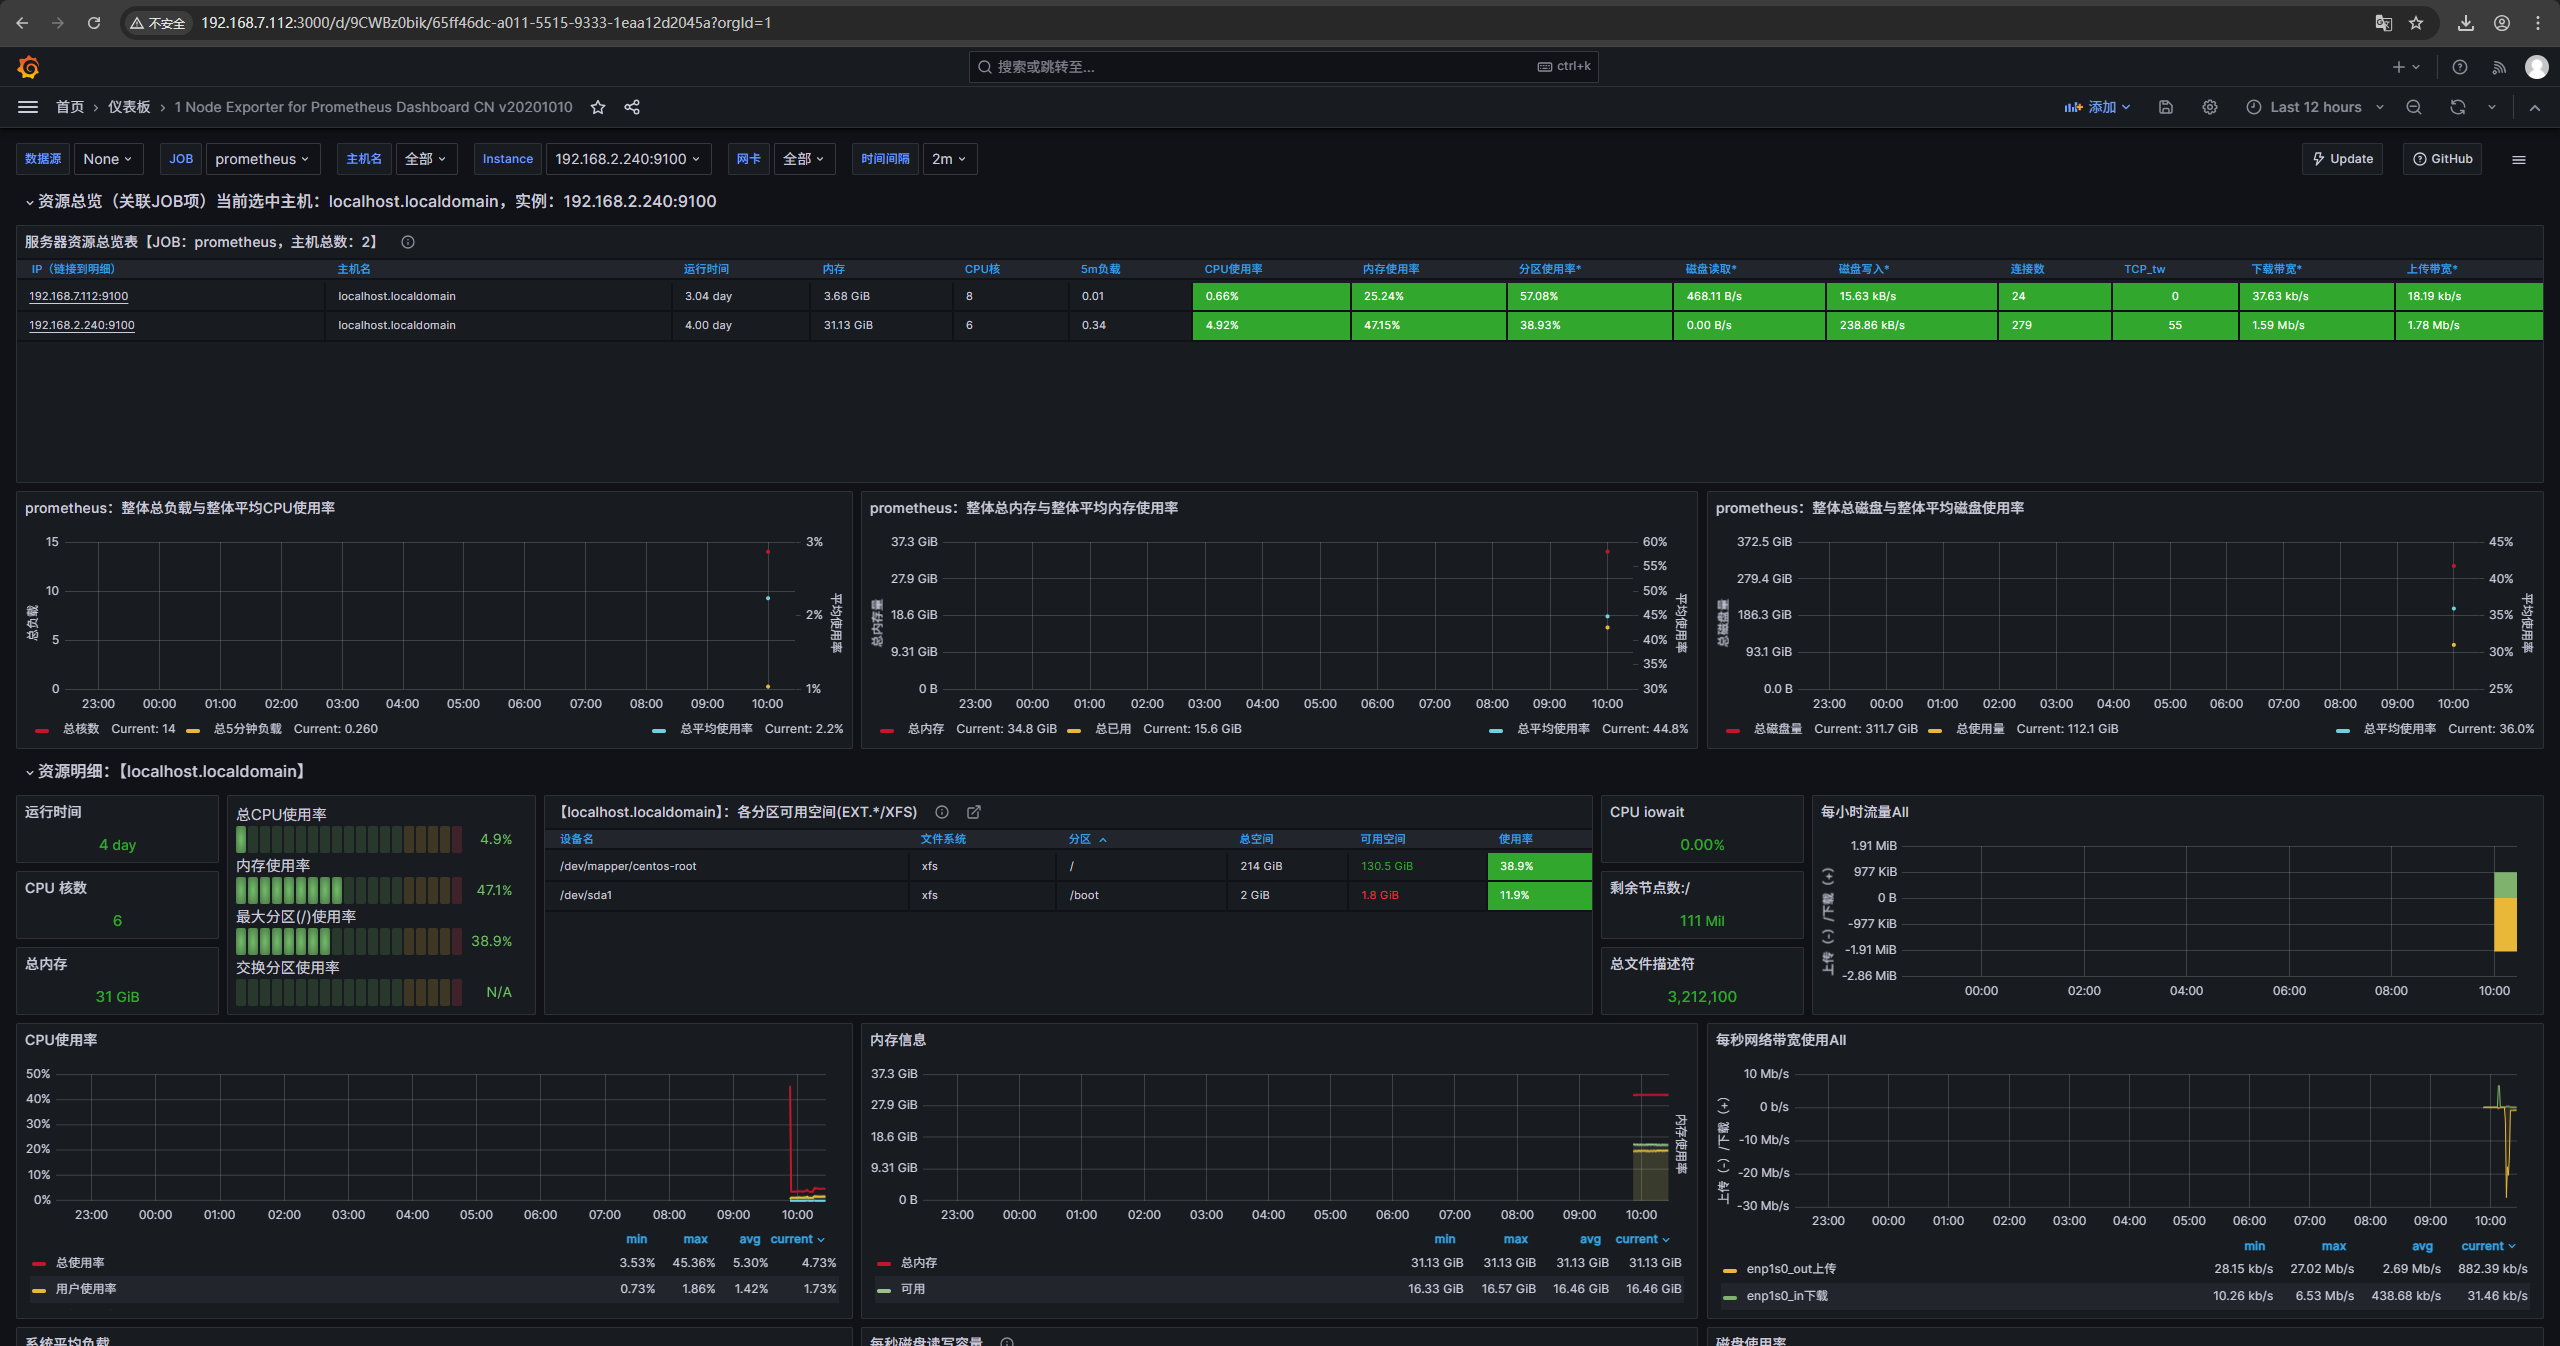
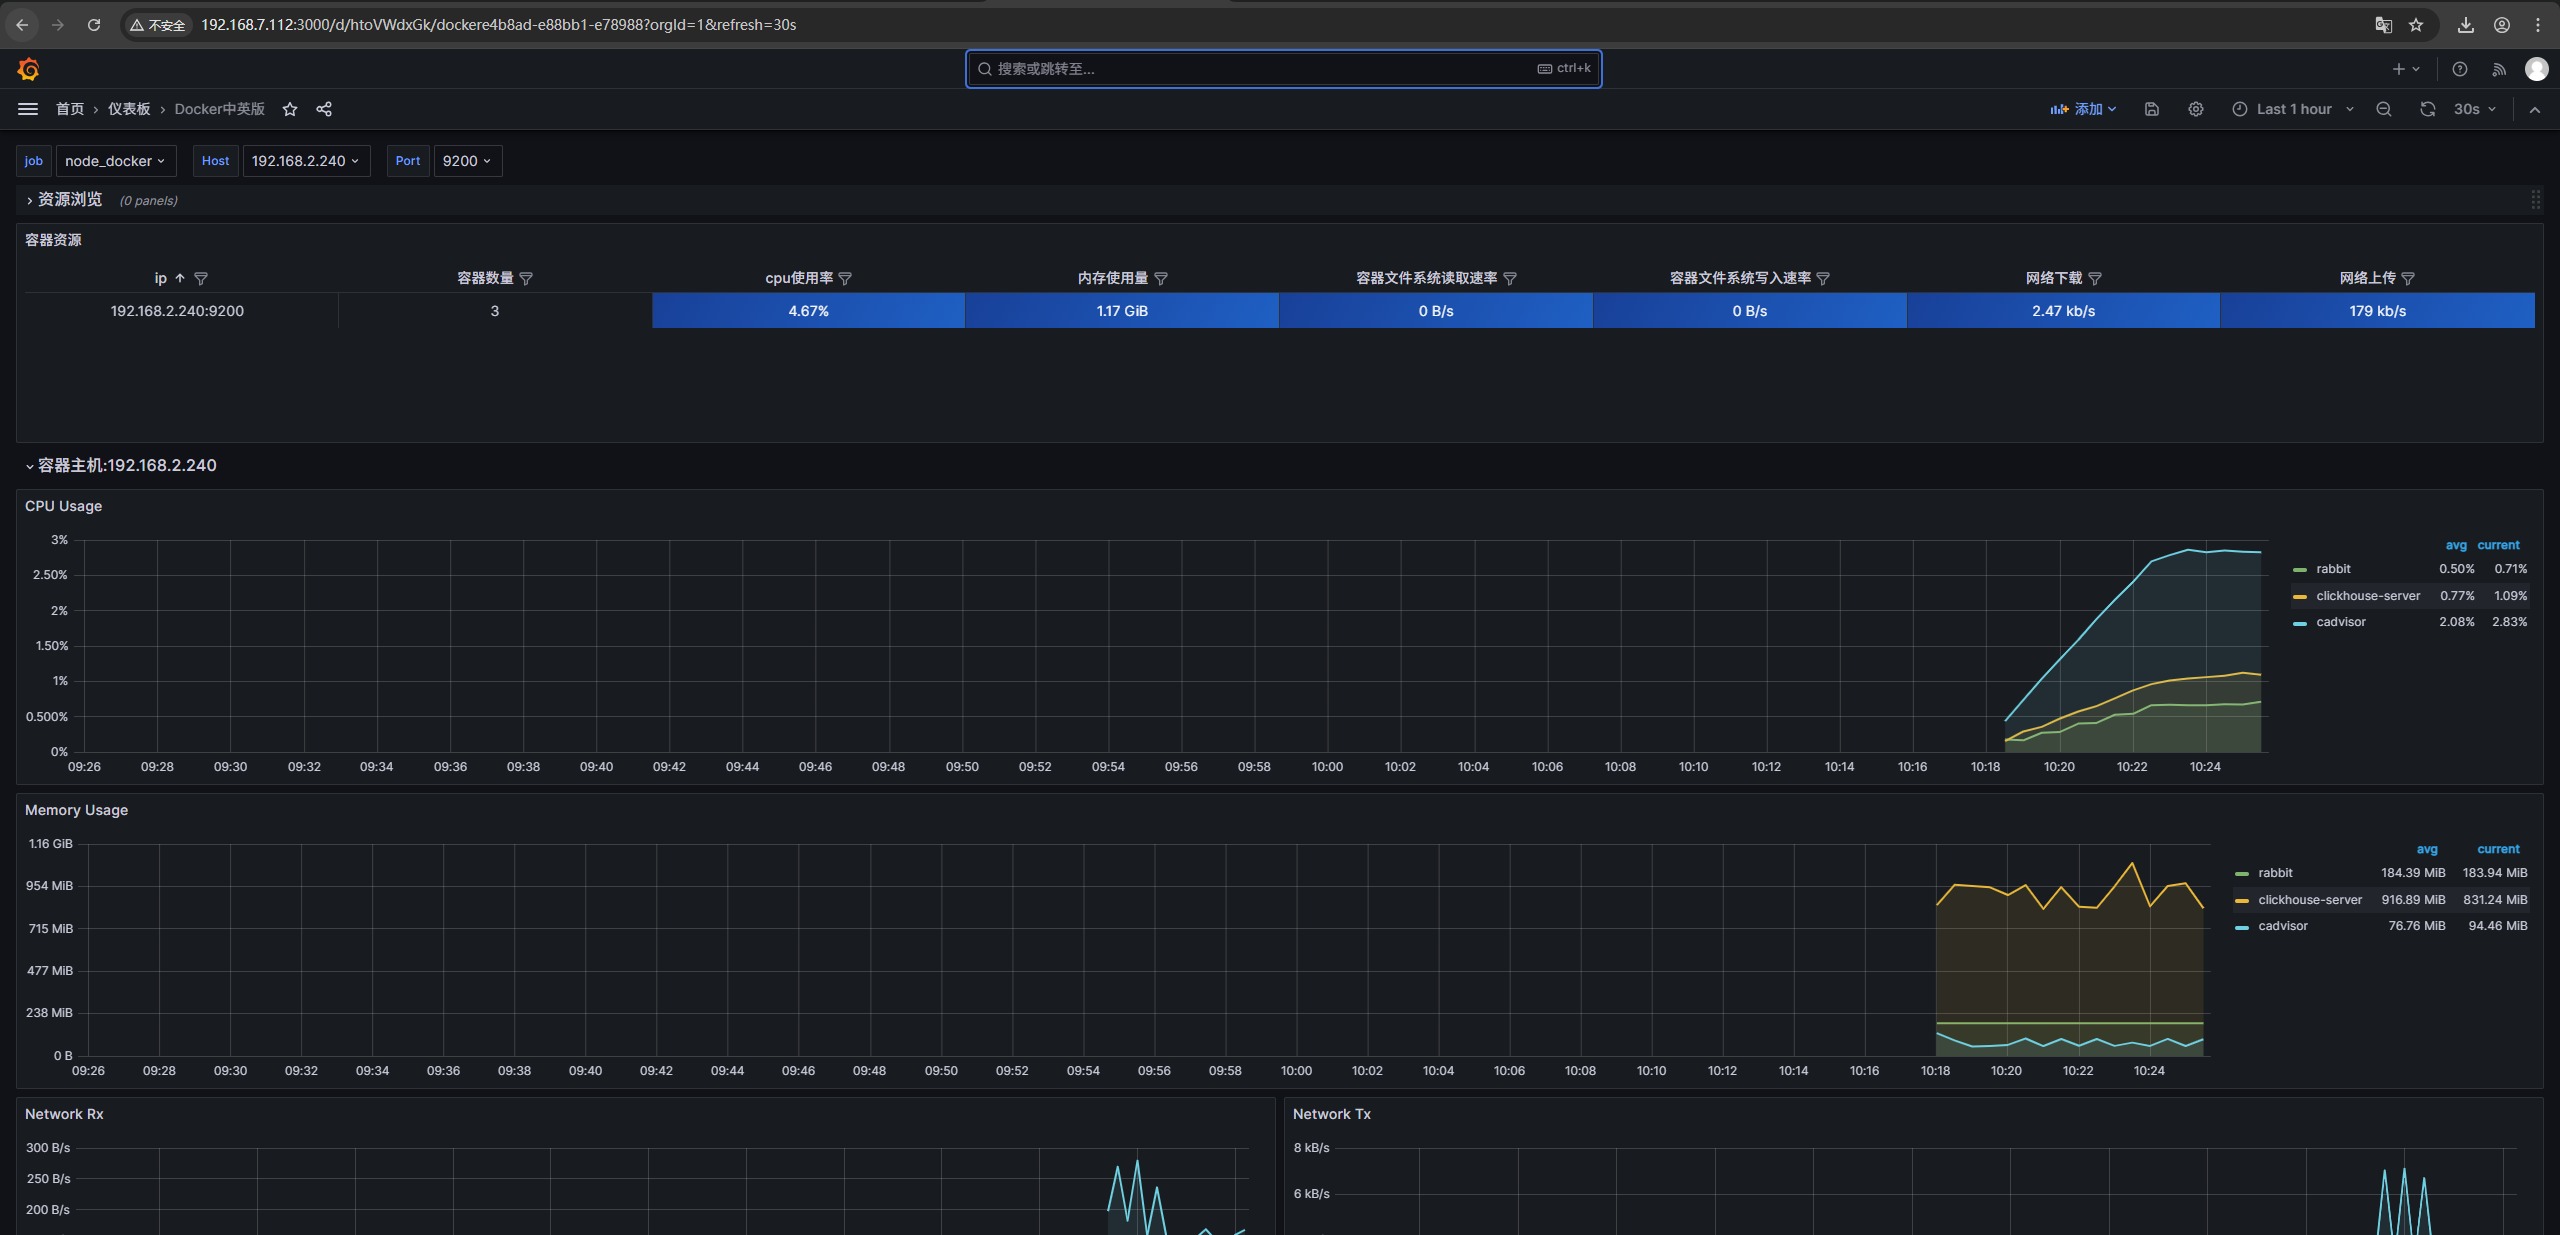
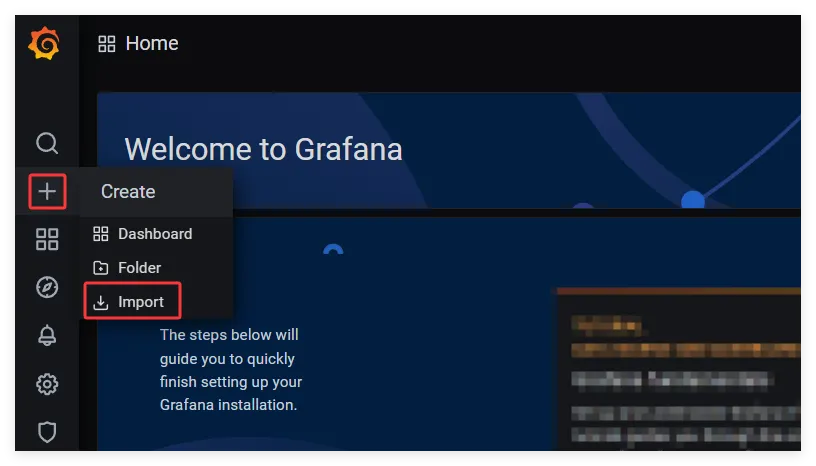
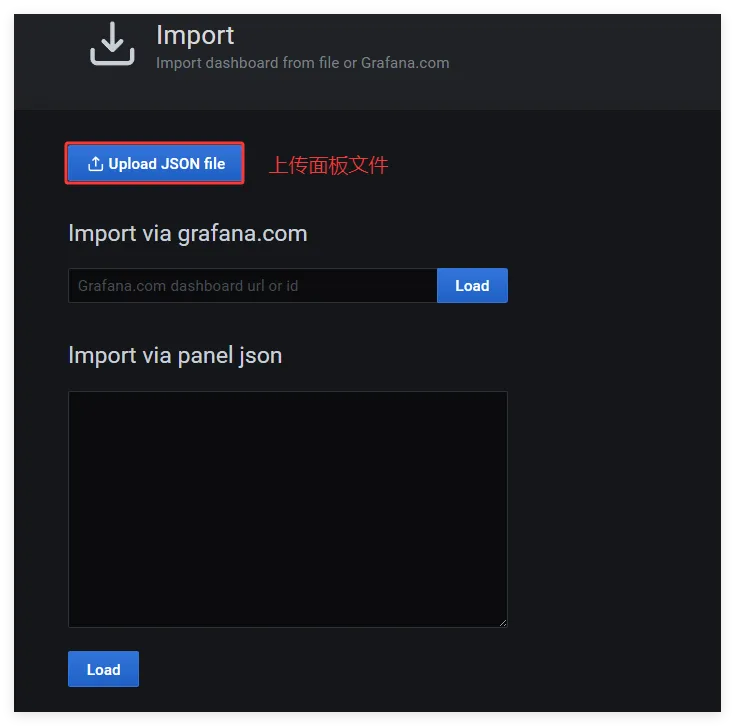
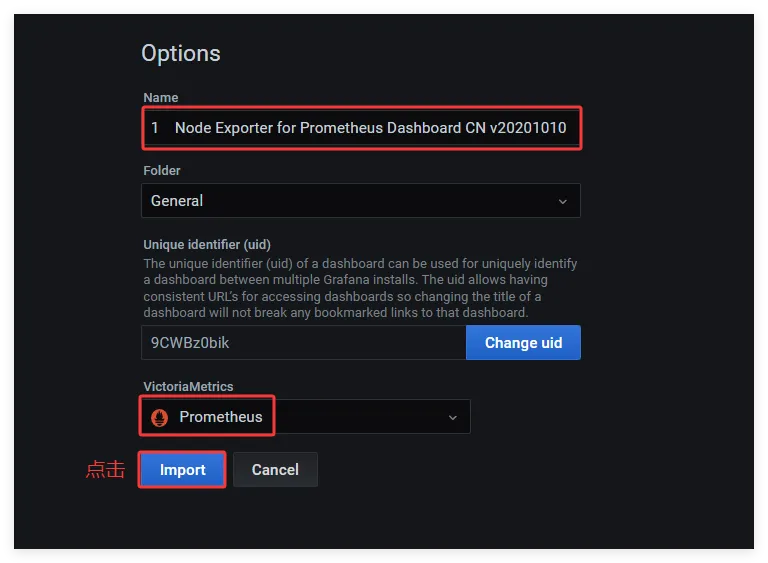
3.4、导入 Grafana 监控面板
导入 node_exporter 与容器监控面板
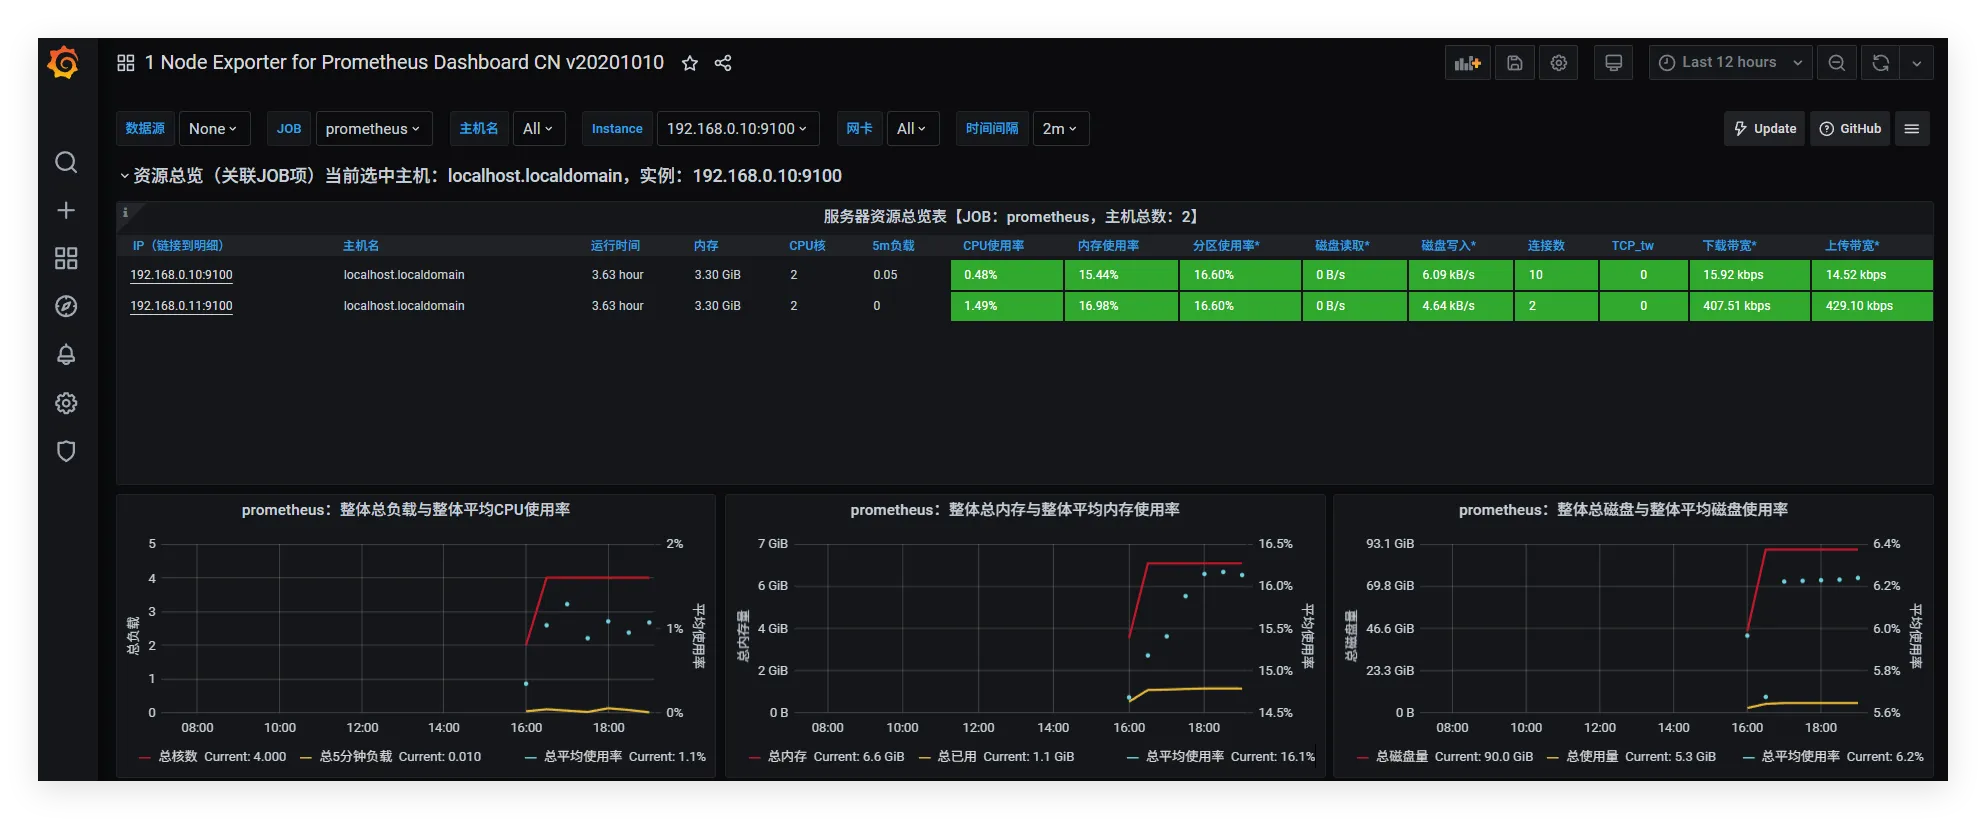
4、面板展示